 鲜花( 85)  鸡蛋( 2)
|
本帖最后由 easygoing 于 2015-2-2 19:12 编辑
- |2 ^7 U1 ]# B' v1 x; G1 n
. N$ L. Z2 ]7 Q! F# O4 I" L & `2 [9 M2 `" I. C$ e5 u & `2 [9 M2 `" I. C$ e5 u
 7 l, Q$ D6 U, U4 \3 X2 _$ E
* I& V, L, G9 S& v' r
Daily Chart - Created Using FXCM Marketscope
6 N, w% P* D3 m- U$ {7 X: P/ w* \
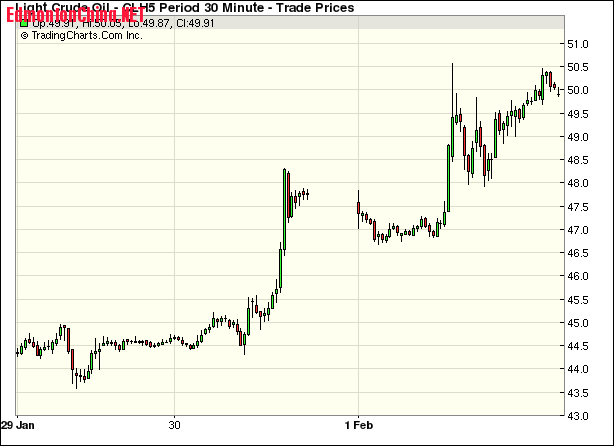
CRUDE OIL TECHNICAL ANALYSIS - Prices pushed higher following a prolonged period of consolidation after bottoming as expected above the $45.00/barrel figure. A daily close above the 23.6% Fibonacci retracement at 53.77 exposes the 38.2% level at 59.08. Alternatively, a reversal below the 14.6% Fib at 50.49 targets the 14.6% Fib expansion at 47.07. |
|
